St. Jude Family of Websites
Explore our cutting edge research, world-class patient care, career opportunities and more.
St. Jude Children's Research Hospital Home

- Fundraising
St. Jude Family of Websites
Explore our cutting edge research, world-class patient care, career opportunities and more.
St. Jude Children's Research Hospital Home

- Fundraising
Cloud redesign offers enhanced user experience

St. Jude Cloud redesigned its site to include a set of independent applications to better serve scientists.
Since the launch of St. Jude Cloud two years ago, we’ve expanded from offering our pediatric genomics data globally to developing a vibrant ecosystem of sharing at St. Jude Children's Research Hospital.
But our vision is to do more.
With this in mind, we recently updated the structure and design of St. Jude Cloud.
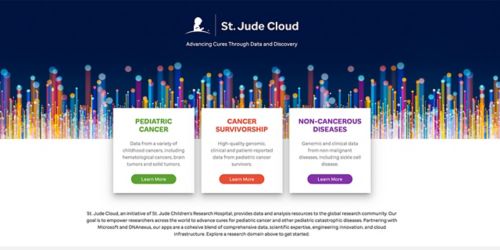
We examined how users were interacting with the site and made a major shift in the site’s structure from "Data, Tools, and Visualizations" to a set of independent applications, or apps.
This way, the understanding of what each application does is consistent among users, which allows us to adapt and expand St. Jude Cloud.
Each app has its own identity within the St. Jude Cloud ecosystem and is designed to address a particular use case. Apps, which are developed by teams across St. Jude, offer integrations between one another to enable cross-functional workflows.
As the diversity of offerings in St. Jude Cloud grows, it is important for new users to know which areas of St. Jude Cloud are relevant to their research. We’ve redesigned the homepage around broad areas of study, called research domains, to act as a guide to areas of St. Jude Cloud that are relevant to researchers in these fields.
What new applications are available in St. Jude Cloud?

Genomics Platform enables users to access and analyze large next-generation sequencing (NGS) datasets in the cloud. Built on top of the DNAnexus ecosystem and powered by Microsoft Azure, users can easily request access to the petabyte-scale NGS data in St. Jude Cloud alongside their own data. All this data can be processed by a wide variety of community-written analysis tools.

PeCan features the pediatric cancer variation knowledge base curated by researchers at St. Jude. It presents a cohesive picture of the ever-growing knowledge we discover about pediatric cancer through analyzing omics data. You can browse information on pathogenicity classification, variant recurrence and much more from samples contributed by St. Jude, NCI TARGET, German Cancer Research Center, Shanghai Children's Medical Center, UT Southwestern, Broad Institute and the Medulloblastoma Advanced Genomics International Consortium (MAGIC).

Visualization Community, the newest addition to the St. Jude Cloud ecosystem, is home to unique visualization tools such as ProteinPaint, GenomePaint and SJCharts. Here, you can view community-created visualizations using St. Jude tools, create visualizations with your own data to share with collaborators and include in papers, and learn how to embed your own visualizations in your website.
This new structure creates the foundation for many new types of data shared on St. Jude Cloud. In fact, we're already planning apps to explore rich, longitudinal data from our Childhood Solid Tumor Network and Neurobiology and Brain Tumor programs.
Do you have other suggestions for us? Want to share how you’re using St. Jude Cloud? Feel free to reach out at support@stjude.cloud.


