St. Jude Family of Websites
Explore our cutting edge research, world-class patient care, career opportunities and more.
St. Jude Children's Research Hospital Home

- Fundraising
St. Jude Family of Websites
Explore our cutting edge research, world-class patient care, career opportunities and more.
St. Jude Children's Research Hospital Home
- Fundraising
If link downloads do not work, copy and paste into a new tab or window.
Performance is best in the Firefox browser.
CONSERTING (Copy Number Segmentation by Regression Tree in Next Generation Sequencing) is an accurate method for detecting somatic DNA copy number variation in whole genome sequencing data.
- Download CONSERTING package (1.6 MB)
- Download Test Data for CONSERTING (1704 MB)
- The Amazon Machine Image in AWS cloud has been deprecated. Please use the source code links above.
- Download dependency packages:
- Bambino package (1.8MB)
- Picard (559KB)
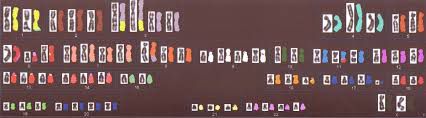
SKY mapping for COLO-829 (downloaded from Dr. Paul Edwards’ web site (https://web.expasy.org/cellosaurus/pawefish).
WGS coverage tracks (ELCR and average coverage)
Two types of coverage tracks are provided based on the high coverage (>20x haploid coverage) whole genome sequencing (WGS) of human and mouse germline samples. The first one is called ELCR (Empirical Low Coverage Region), which indicates how often a region is poorly covered in WGS, and the second one is the average coverage track that shows the coverage depth in general. Currently, there are three tracks available: 1) one hg18 track based on 15 TCGA germline samples; 2) one hg18 track based on16 PCGP germline samples (Zhang et al. 2012); and 3) mouse mm9 based on 15 Sanger mouse wild-type samples (Keane et al. 2011).
ELCR is a BED format UCSC genome browser track that collects the frequently poorly covered (<10x) regions across multiple WGS germline samples. Each line contains the following fields: chr, start, end, percent_of_samples_poorly_covered, grey_scale_color. The track is constructed with the following procedures: 1) The genomic average coverage was calculated with the effective coverage on all 22 autosomes, excluding sequencing gaps. The poor coverage is defined as less than 10x, which is less than the 10th percentile in every TCGA and PCGP sample. 2) For a particular base, define as a 'commonly poorly covered base' if >3 samples were below 10x. 3) For adjacent bases, merge and extend if both are 'commonly poorly covered bases', otherwise, a low coverage segment ends. 4) Merge two adjacent segments if they were less than 50 bases apart. 5) Drop any short segments that were less than 10 bases long. The final list of poorly covered segments was defined as ELCRs. Each segment is characterized with an average frequency of samples covered less than 10x.
In addition, for each dataset, a bigWiggle format file is provided to summarize the average coverage at each genomic base across all samples used to construct the ELCR. These files can be loaded directly to UCSC genome browser for visualization (see Instructions on the use of bigWig). Note: you don't need to download the bigWiggle files for visualization, simply point the URL to files below as shown in the example here (save this file and load to UCSC genome browser to test).
Download
TCGA hg18 tracks: TCGA_WGS_ELCR (16.7 MB), TCGA WGS Average Coverage (3.1 GB)*
PCGP hg18 tracks: PCGP_WGS_ELCR (7.4 MB), PCGP WGS Average Coverage (2.0 GB)*
Sanger mouse mm9 tracks: Mouse_WGS_ELCR (7.4 MB), Mouse WGS Average Coverage (2.7 GB)*
*If this link does not open when you click on it, copy and paste it into a new browser window.